
Why compare the full cost of foundry sand?
Sand can seem inexpensive. Recovering used sand, however, requires equipment, electricity or fuel, maintenance and testing. Why would a foundry pay for sand reclamation?
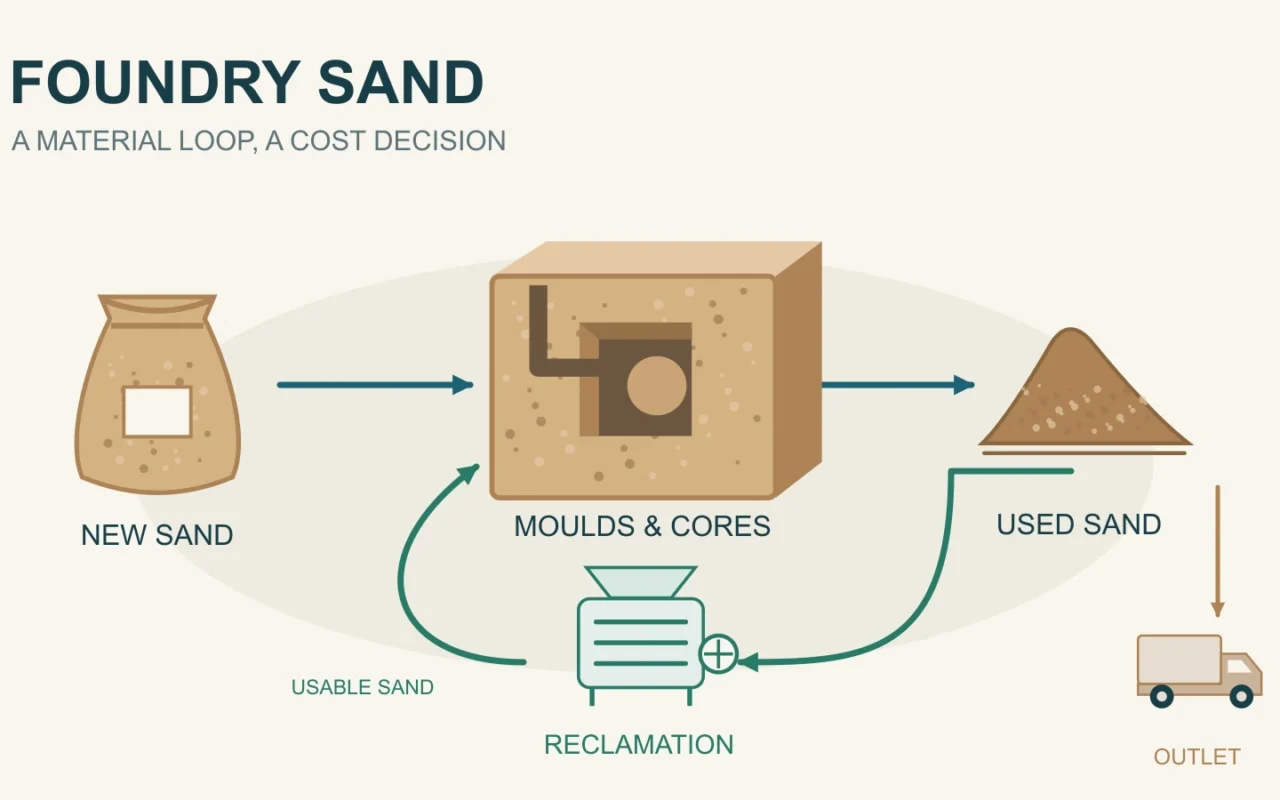
The answer lies in the complete sand bill. A foundry pays to buy and deliver new sand, as well as to haul away and manage outgoing used sand. If reclaimed sand meets production requirements, actually replaces some new sand and reduces outgoing waste, it may lower total expenditure. Reclamation also has costs, so its value must be assessed against the foundry’s current practice.
The useful question is how much less the foundry actually spends each year while producing the same quantity of acceptable castings.
Purchased sand must meet production requirements
Foundry sand helps a mold retain its shape when hot metal is poured and works with the binder to develop the required strength. Grain size, impurities and compatibility with the process affect its suitability. The American Foundry Society’s introduction to foundry sand explains that foundry sand must meet physical and chemical quality requirements, and poor sand quality can cause casting defects.
This does not mean foundry sand is necessarily expensive. It means purchasing teams should compare sands suitable for the same application, rather than selecting solely by the lowest price per tonne. For sand printing, the properties and suitability of printing sands provide further context.
After a mold is broken down, some grains may still be useful, but the sand can contain residual binder, fines and other contaminants. Reclamation aims to return usable sand to a condition suitable for its intended application. Collecting used sand is only the starting point: whether the treated material can be used, and how much new sand it replaces, determines its economic value.
The sand bill includes material coming in and going out
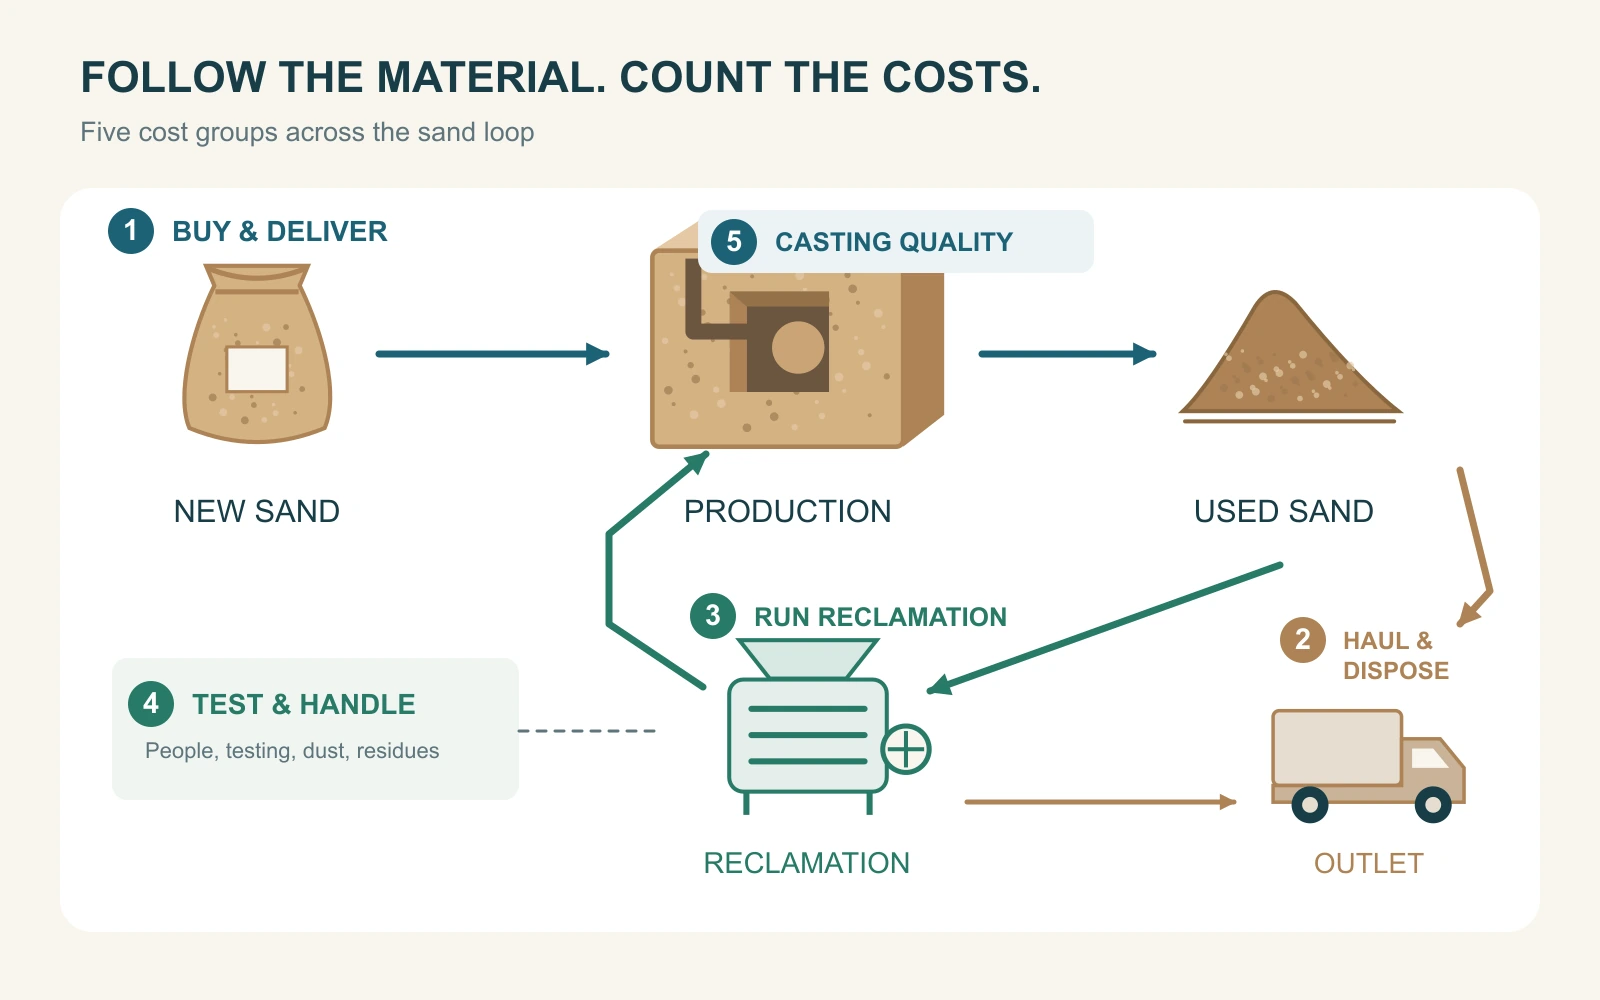
Comparing only the purchase price of new sand with the price of reclamation can leave out transport, residue management and changes in casting quality. Group the relevant expenditure into five categories:
| Cost category | Expenditure to check |
|---|---|
| New sand entering the foundry | Purchasing, inbound transport and associated handling |
| Used sand leaving the foundry | Outbound transport, receiving or disposal charges |
| Reclamation operation | Electricity or fuel, maintenance and wear parts |
| Supporting management and treatment | Labor, testing, dust collection and separated residues |
| Downstream production changes | Changes in binder, casting cleaning, rework and scrap costs |
Equipment supplier Simpson’s sand reclamation calculation tool also asks for annual quantities and costs for new sand, additives and waste sand. These inputs show why the economics involve the whole material flow. A foundry must still add its own operating and quality data to calculate its benefit.
A small saving per tonne can accumulate over sustained use. Suppose the genuine net saving is CNY 10 per tonne and the applicable annual quantity is 10,000 tonnes: that adds up to CNY 100,000. This is an arithmetic illustration only. A net saving already deducts the additional expenditure required to achieve it.
Check whether the bill really falls. If new sand is priced on a delivered basis, do not add the same freight again. Similarly, avoid double counting where outgoing transport and disposal are quoted together. Minimum transport charges or fixed disposal contracts mean one less tonne does not necessarily save one tonne’s fee. Use the amount that can actually be removed from the bill.
Keep investment separate from operating expenditure. Do not assign the entire historic purchase price of an existing system to the proposed project’s additional investment; include newly required supporting facilities and installation instead. In an annual full-cost comparison, common costs may be shown, but they should not be deducted repeatedly when calculating additional savings.
Compare reclamation with the foundry’s current practice
Many foundries already circulate sand. The US EPA’s overview of spent foundry sand explains that sand can be reused several times within a foundry, with some unsuitable sand continually removed and new sand added.
Before assessing a new reclamation unit or improvements to an existing system, record current new-sand purchases, outgoing sand and existing reuse routes. Sand already reused cannot be counted again as savings created by the new project. Annual molding-sand throughput is also different from annual new-sand purchases: the same sand can be counted in production throughput several times as it circulates.
Compare the same reporting period, acceptable casting output and product mix, and check inventory movements. A reduction in purchases caused by using warehouse stocks cannot all be credited to reclamation. If the mix of parts differs substantially between years, first explain the resulting change in sand demand.
Measure collected used sand, reclamation feed, acceptable reclaimed output and actual replacement of new sand separately. Producing 100 tonnes of treated sand does not automatically reduce purchases by 100 tonnes. Only material suitable for its intended use and actually consumed in production can generate purchasing savings.
Identify which new sand is being replaced. If the reclaimed material suits only certain molds, treating all new-sand demand as replaceable overstates the benefit. Record how long the trial inclusion rate can be maintained and whether different orders provide a suitable outlet. Successfully treating one batch is different from reducing purchases reliably throughout the year.
Readers new to these operations can review the complete sand casting process, from molding and pouring to shakeout, then match the sand entry and exit points to their own foundry records.
A hypothetical example: gross savings versus net savings
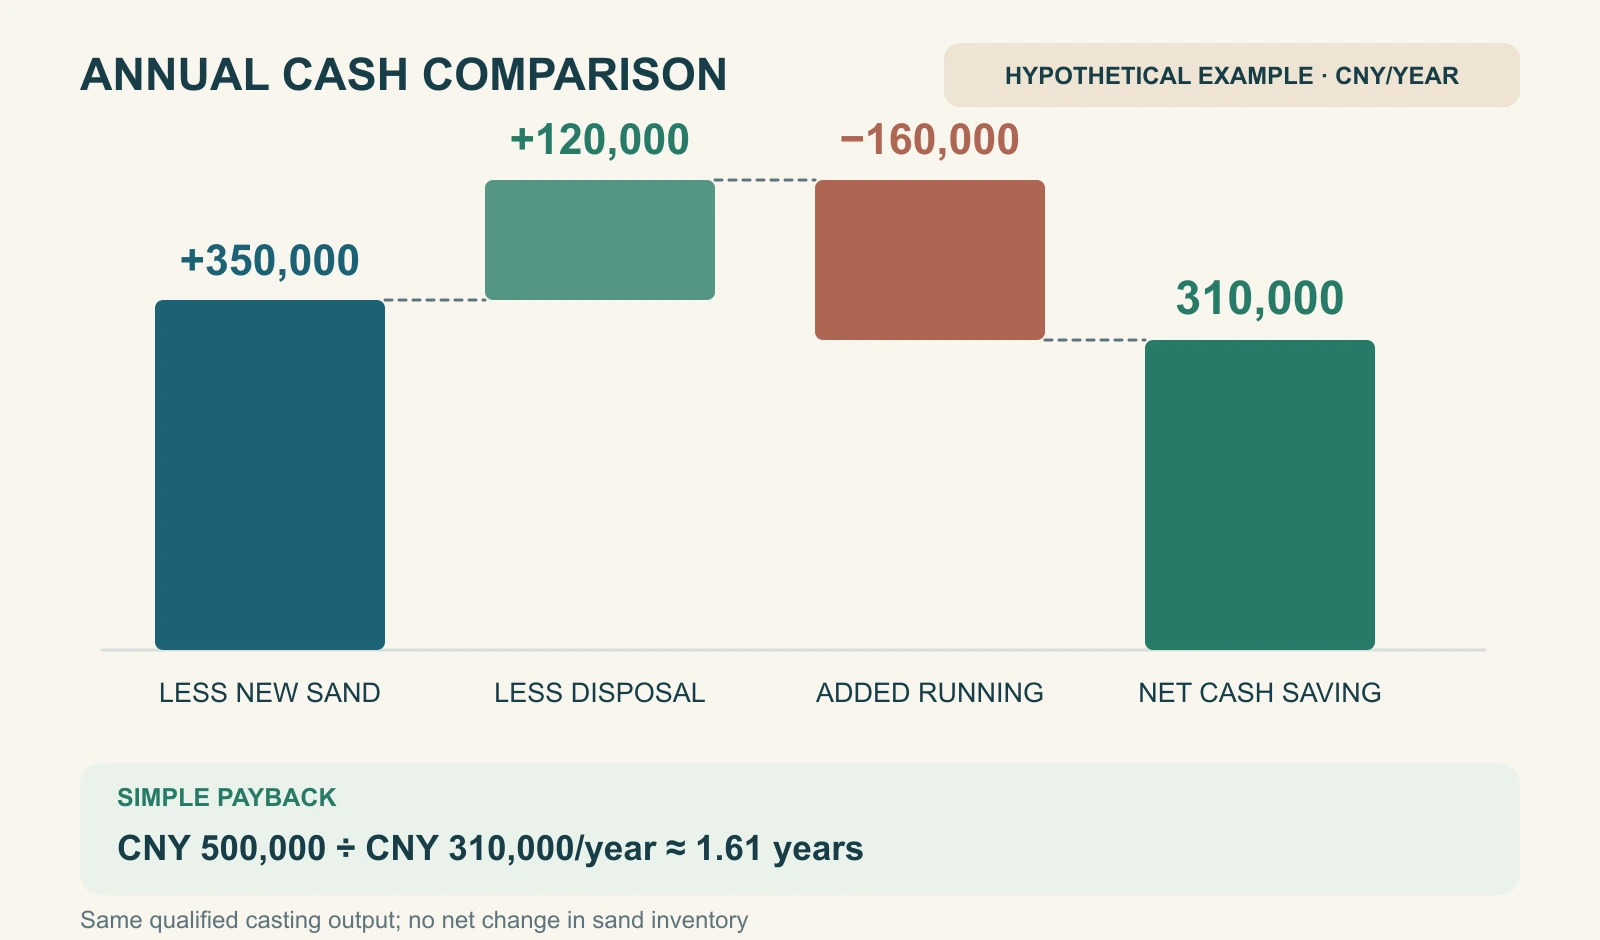
Every figure below is a teaching assumption, not a market sand price, equipment quotation, industry average or customer case. Assume both options produce the same acceptable casting output, each uses 10,000 tonnes of molding-sand throughput annually and sand inventory has no net change. The foundry already reuses sand; the proposed option improves reclamation within that existing loop.
| Calculation input | Current option | Proposed option |
|---|---|---|
| Actual annual new-sand purchases | 2,000 tonnes | 1,000 tonnes |
| Annual outgoing used sand charged on the same basis | 2,000 tonnes | 1,000 tonnes |
| Assumed delivered new-sand price | CNY 350/tonne | CNY 350/tonne |
| Assumed combined transport and disposal fee | CNY 120/tonne | CNY 120/tonne |
| Additional annual operating cash expenditure | — | CNY 160,000 |
| Additional fully installed investment | — | CNY 500,000 |
The CNY 160,000 includes additional energy, labor, maintenance, testing and associated residue management. Costs common to both options are not counted again. For simplicity, quality-related costs are assumed unchanged, and fines and other residue streams are not itemized separately.
Buying 1,000 fewer tonnes of new sand avoids CNY 350,000. Sending out 1,000 fewer tonnes of used sand under the assumed charging conditions avoids another CNY 120,000. The combined CNY 470,000 is the improvement’s gross saving: expenditure that can be avoided.
After deducting the additional operating expenditure, annual net cash savings are:
CNY 470,000 − CNY 160,000 = CNY 310,000.
The CNY 500,000 fully installed investment includes the equipment and newly required supporting facilities, civil works, electrical installation and commissioning. Dividing it by positive annual net cash savings gives the simple investment payback period:
CNY 500,000 ÷ CNY 310,000/year ≈ 1.61 years.
This calculation assumes stable annual net cash savings and excludes financing, taxes, the time value of money and production ramp-up. It supports an initial comparison, not a guaranteed payback date. Depreciation can be included separately in an annual accounting-cost comparison; do not deduct it again in this cash-based payback calculation, which would count equipment investment twice.
Changing the conditions changes the result. If only the assumed delivered new-sand price falls to CNY 150 per tonne and the combined outgoing-sand fee to CNY 50 per tonne, with other inputs unchanged, annual net cash savings become:
1,000 tonnes × (150 + 50) CNY/tonne − CNY 160,000 = CNY 40,000.
Simple payback is then 12.5 years. Additional rework or scrap costs would further reduce that CNY 40,000. If net savings are zero or negative, there is no finite simple payback period.
What strengthens or weakens the economics of reclamation?
Start with effective throughput. Equipment capacity is not the same as the quantity of suitable used sand actually available each year. Fluctuating output, mixed sand streams, downtime or a lack of suitable applications can reduce actual new-sand replacement below the plan. Sustained underutilization also increases the fixed expenditure carried by each tonne of usable output.
Next, consider delivered new-sand cost and the destination of outgoing sand. Distant suitable sand sources and expensive waste transport may create more financial scope for reducing incoming and outgoing tonnes. If a reliable source is nearby and outgoing sand has a low-cost receiving route, calculate the project afresh rather than adopting another foundry’s conclusion.
Transport also affects environmental assessment. In a life-cycle model for one US foundry, Ghormley and colleagues’ 2020 study found that changes in transport distance substantially changed the comparison. That environmental result is a reason to examine distances. Financial savings must still be calculated using the foundry’s actual freight and management costs.
Assess the treatment method and quality results as well. Reclamation methods can differ in energy, maintenance, dust collection and supporting requirements. The treatment needed depends on the sand, binder and intended application. Quality control for foundry sand, binders and the used-sand loop also affects usable output and downstream costs.
If trials require more binder or increase casting cleaning, rework or scrap, include those costs in the comparison. Only improvements supported by trials or production records should enter the benefit calculation. Test the foundry’s own sand first, then track its actual use and refine the estimate.
Other options include reducing spillage, improving separation of sand streams, adjusting the current system, sourcing suitable sand closer to the foundry and considering external reclamation services. External services must include return transport, treatment fees and quality acceptance costs. Compare them against the same baseline to identify the more suitable improvement.
Assess environmental and economic outcomes separately. Lower use of virgin sand and less outgoing used sand can be considered in resource and environmental assessments. Whether the foundry spends less cash depends on actual cost changes. Environmental improvement cannot substitute for a net-savings calculation or establish a universal equipment payback period.
Account for different sand streams in 3D sand printing
In sand printing, loose unbound sand surrounding printed parts has a different history from used sand separated from molds and cores after pouring. The former may already contain added hardener or other materials; the latter has undergone forming and casting. Assess their treatment conditions and potential reuse routes separately.
HA’s additive manufacturing materials guidance states that full or partial return of unbound sand depends on the particular system and treatment conditions. A loose-sand reuse percentage for one material system therefore cannot be presented as the reclamation rate for sand after casting.
Account for failed or broken sand parts separately, according to their processing history, material condition and destination. If different accounting methods are used for different streams, check that the same sand has not been counted twice as a reduction in new-sand purchases.
The Cprint 3D SJ-1200 directly produces foundry sand molds and cores using a furan resin and hardener system. Site assessment should address printing-material suitability, reuse conditions for unbound sand and treatment of sand after casting separately. When preparing printing trials or material assessments, review the SJ-1200 sand 3D printer and calculate the printing system’s investment and operating costs separately from those of the used-sand reclamation system.
Gather these foundry data before deciding
Start an initial estimate with the following data:
- Current sand baseline: annual new-sand purchases, delivered price, existing reuse and inventory changes.
- Outgoing sand: quantities by destination, transport and management costs, fixed fees and minimum charges.
- Proposed usable output: reclamation feed, acceptable output, actual replacement of new sand and trial results.
- Complete additional expenditure: equipment, installation and supporting facilities, expected annual utilization and additional operating cash costs.
- Casting production results: changes in binder, cleaning, rework and scrap costs at equal acceptable output.
Calculate both normal production and lower-output scenarios to see whether net savings remain when costs or usable output change. Retaining purchasing, transport, disposal and trial records makes the estimate easier to audit than quoting a recovery percentage alone.
A low delivered new-sand price reduces the purchasing savings available from reclamation, while sustained usage and outgoing-sand costs may expand the scope for improvement. The economic benefit ultimately depends on whether the treated sand can be used reliably and how much expenditure the foundry can actually avoid. Compare those avoided costs with the additional expenditure to decide whether reclamation is worthwhile.